
1924 · Farm fields and telephone factories
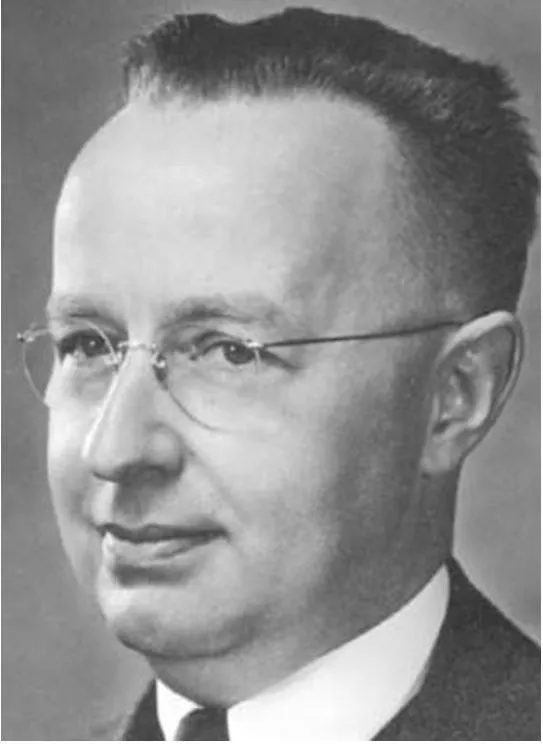
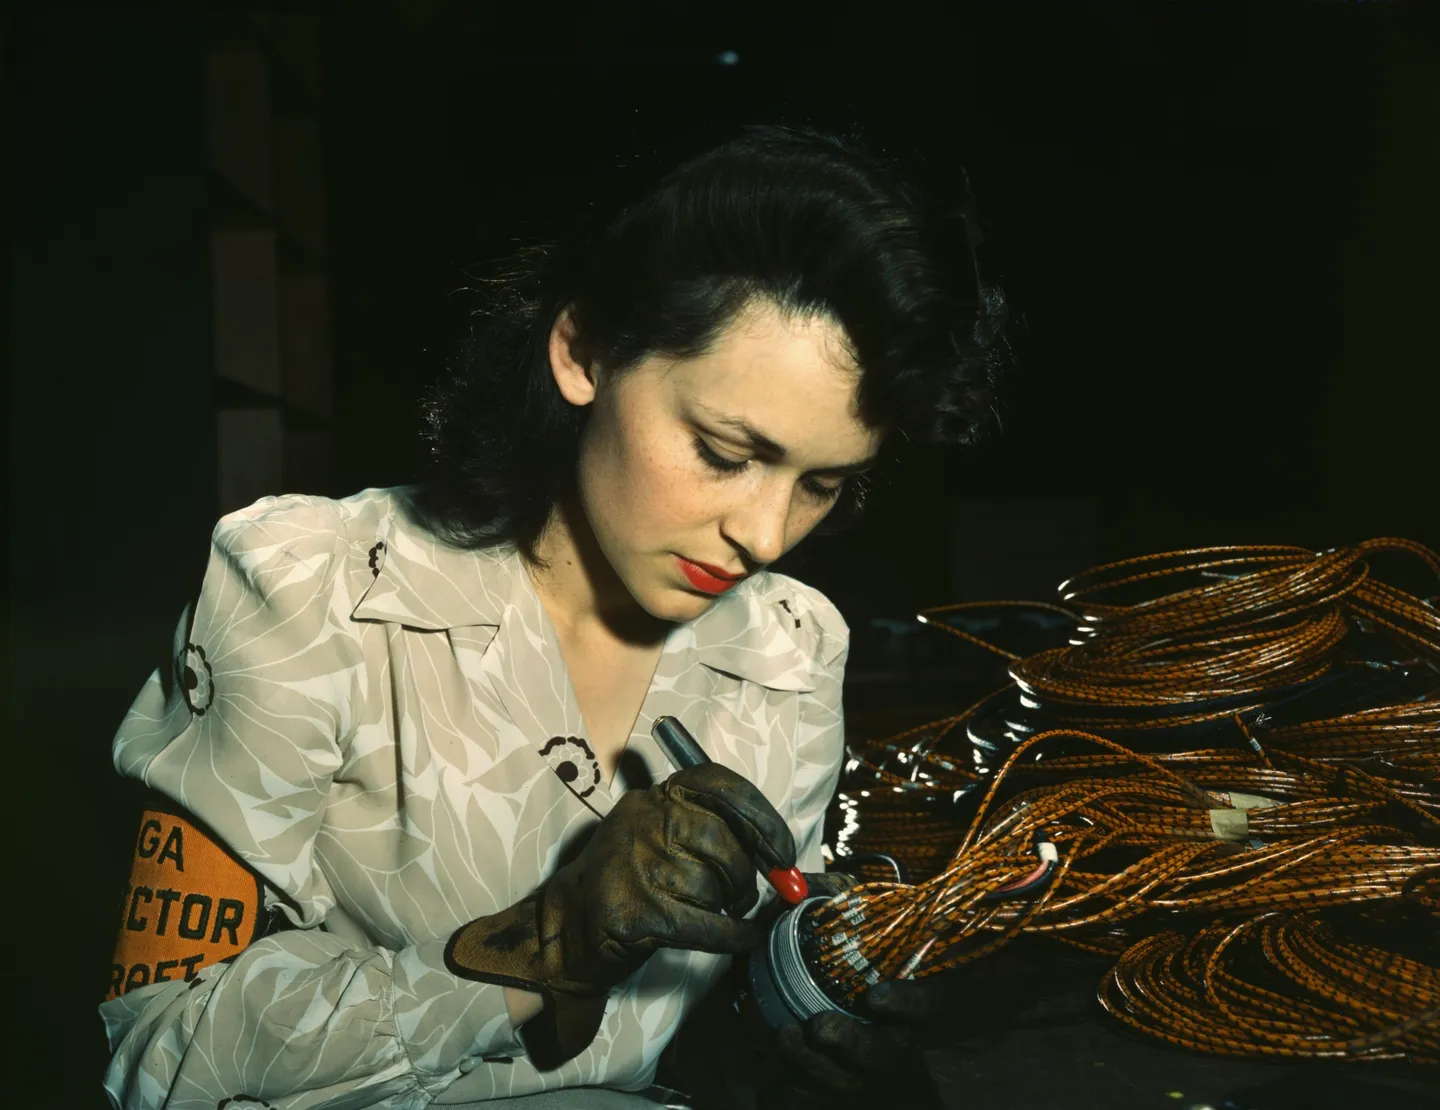
It started with statistics, first in farm fields, then in telephone factories. On 16 May 1924, at Western Electric, Walter Shewhart drew the first control chart: a way to tell a real change from noise.
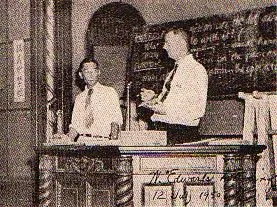
In 1939 he described a cycle that would outlive him. Specification, production and inspection "must go in a circle instead of in a straight line." It was science, applied to making things. The man who had brought him to lecture, at the US Department of Agriculture, was a young statistician named W. Edwards Deming.